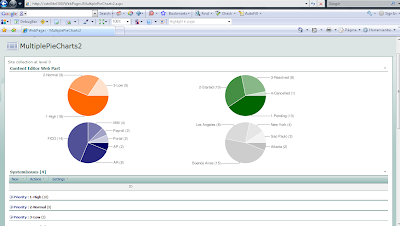
I finally got a script to get multiple Pie Charts on the same page!!!
In the screenshot, I show an hypothetical systems issues list, grouped by priority, status, system and site. You can represent different views of the same list or you can include multiple lists!!!
NOTE 1: avoid group by columns with "(" and ")" symbols as part of its name. Otherwise you should modify the code accordingly, because those are used to isolate the number of items within each group.
NOTE2: do not use this technique to represent sensitive data, as it travels through the Internet to the Google Charts service.
Here the process to implement:
1) Plan your page, that is, pre-define how many charts you will need (for some reason, if you add List View web parts AFTER you have inserted the script, new charts might not be rendered).
2) Create the Grouped views that you will need through the default List View, so you when you add the list views to the page, you can simply select the desired view from the drop down list.
3) Create a new web part page, add the List View web parts you previously defined, and arrange them (up to down, left to right) in the order you want the charts to appear.
4) Copy the script to your preferred editor and:
a) Configure the colors for your charts in the following code line:
chColor=new Array("FF6600","006600","000066","C0C0C0");
If you plan to use more than 4 charts, add more color codes with the same pattern.
b) If you want, change the size (in pixels) and type of chart ("p" or "p3") in the following portion of the URL for the charts:
...chart.apis.google.com/chart?cht=p&chco="+col+"&chs=500x150&chd=t:"+txt+"&chl="+txt1
For more information on how to customize the chart, see http://code.google.com/apis/chart/
c) Edit the path at the beginning of the script so it points to your jQuery library store.
5) Insert a CEWP (Content Editor Web Part) on the page, open the toolpane, then Source Editor and paste the script you have just configured. Thats it!
6) You can hide part or all the List Views so the page does not look "congested". To do so, open the tool pane of the List View web parts, go to "Layout" section and check "Hidden".
I hope you enjoy this!
<div id="jLoadMe" class="content"><strong></strong></div>


<script src="/jquery/jquery.js" type="text/javascript">

   // To load jQuery (redefine the path if necessary)

</script>


<script type="text/javascript">

/*

* WORKING VERSION 1.0

* Multiple Pie Charts in SharePoint

* By Claudio Cabaleyro (2009)

*/


$("document").ready(function () {

  chColor=new Array("FF6600","006600","000066","C0C0C0");  // add more colors if you include more than 4 ListView web parts

  var ListViewArray = $('table.ms-listviewtable');

  $(ListViewArray).each (function(j) {

   var Grp = $(this).find ('td.ms-gb:contains(":")');


     var coord= new Array();

     var labels= new Array();

     $.each(Grp, function(i,e) {

      var MyIf= $(e).text();

      var txt= MyIf.substring(MyIf.indexOf('(')+1,MyIf.length-1); // Extract the 'Y' coordinates

      coord[i]=txt;

      var txt1= MyIf.substring(MyIf.indexOf(':')+2,MyIf.indexOf("(")-1); // Extract the labels

      labels[i]=txt1+"("+txt+")";   //add also coordinates for better read

     });

   var txt= coord.join(",");

   var txt1= labels.join("|");

   col= chColor[j];


   // Adjust Chart Properties below - See Google Charts API for reference

   var vinc= "<IMG src='http://chart.apis.google.com/chart?cht=p&chco="+col+"&chs=500x150&chd=t:"+txt+"&chl="+txt1+"'/>";

   if (j%2 == 0)

    ;

    else

    vinc=vinc +"<br>";


   $("#jLoadMe").append(vinc)

  });

})();

</script>

7 comments:
Can't wait to get this to work, but I'm getting a blank CEWP. I've followed the instructions perfectly, and have updated the script src for jquery to be: http://ajax.googleapis.com/ajax/libs/jquery/1.3.2/jquery.js.
I added 3 webparts with different grouped views, but no nice graphs at all. If I replace the code with your exact code for displaying 1 graph, it works fine.
Any ideas?
Ok - I figured out the problem I commented on before. There is a small change that needs to be made:
Current:
('td.ms-gb:contains(':')');
Needs to be changed to:
("td.ms-gb:contains(':')");
Charts show up fine after that ... and your solution is awesome. Thanks so much!
Andrew,
1) It could be a problem with quotes. Try changing the following script line:
var Grp = $(this).find ('td.ms-gb:contains(':')');
to:
var Grp = $(this).find ('td.ms-gb:contains(":")');
or to:
var Grp = $(this).find ('td.ms-gb');
2) If the above fails, please add a debug line after the last instruction, and comment this one adding a double backslash:
\\ $("#jLoadMe").append(vinc)
$("#jLoadMe").append(col+txt+txt1)
This should print on the CEWP the color code, quantity of items separated by commas and labels separated by the pipe character for each chart. If this is not the case, drop me a note with what you get.
Let me know your results.
Regards
You hit the nail on the head ... I figured it out awhile after posting my issue as well. Awesome solution!
Thanks!
Hi Claudio,
I have modified your code to display the Intractive Charts using Google Visualization API. You can access the code at following location:
URL: http://mysplist.blogspot.com/2010/04/intractive-sharepoint-charts-with-no.html
Thanks,
Tahir
Hi Claudio, amazing job by the way.
Im trying to create a pie chart from the totals of the list as %.
for example:
stored backlog
apple 10 5
berry 10 5
Total 20 10
in this case i will group by fruits and sum stored, and backlog.
the pie chart must graph 20, and 10
66% and 33%..
and im lost...
u help will be apreciated
JS
Thanks JS. To show percentages instead of items using this script you would need to make some math manipulation of the variables within the JavaScript. If you are not comfortable with programming I can suggest you to browse at NothingButSharepoint.com, where other colleagues and myself have published other charting solutions that perhaps could be more adequate for your needs.
Regards,
Claudio
Post a Comment