- It uses pure JavaScript libraries, no need to send data to the Google Charts API (i.e. internet).
- Charts are nicely arranged within an HTML table, with configurable columns.
- When you click on a chart, you jump to a target page showing the underlying list view.
- Represented data can be taken from different SharePoint lists.
- At least in theory, an unlimited number of charts can be accommodated on a page.
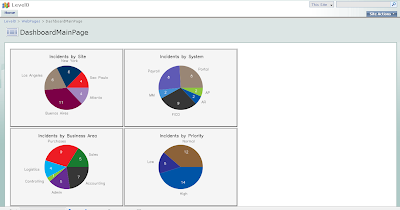
Here is how the result looks like:

I achieved that with the help of the free jsCharts library, and the invaluable code of Paul Grenier, in particular on this EUSP article.
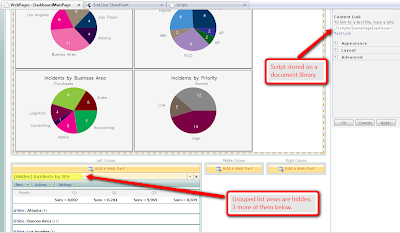
What's the trick? Let us take a brief look at the actual objects on the page:

The charts are within a Content Editor Web Part holding the script, in this case stored as a file on a document library (another trick I have learned from Paul Grenier). Below of the CEWP, there are 4 List View web parts showing grouped items. In the example, I made List View web parts hidden and used only one list, but this is not strictly necessary.
So, what do you need to put this at work?
I will assume that you know how to: create grouped views on lists, create web part pages, add list view web parts and configure them to show specific views. I will also assume that you have jQuery available on your site and know how to insert a script on a Content Editor Web Part. Drop me a note if something below is too badly explained.
In the first place, you need the jsCharts library available, for example stored on the document library that you use for jQuery:

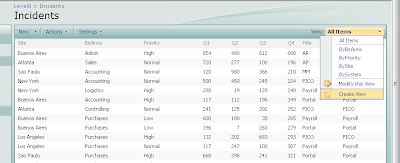
Second step is to create the Grouped Views you plan to use for your charts, using the default SharePoint list view page:

Now you are ready to build your dashboard target pages, using one of the grouped views you just created on each new page. Here is an example:

Build as many pages as lists grouped views you plan to show as Pie Charts, but take into account that if you put too many charts, loading the dashboard page can take a while. Keep track of the URL of each new page as you will need it later to configure the script.
NOTE: you will probably ask why instead of creating different pages to show charts underlying data, do not use the already available web parts on the dashboard page... quite frankly, me too!... I did not find yet the way to do that, but it could make the dashboard much more elegant.
The time to create the dashboard page has come!
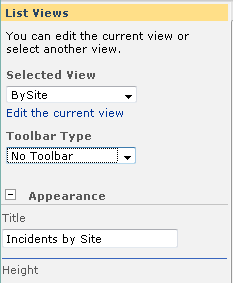
Create a new web part page and insert the Content Editor Web Part to hold the script for the charts. Then add and arrange the list views in the order you want the charts to be displayed. For each list view, configure the following on the tool panel:
- Selected View (choose one of the views you formerly created).
- Title (this will be presented as the chart title)
- On the Layout section select "Hidden" (check box).

Now open your favorite text editor an paste the complete script code by the end of this post. Configure the path for your jQuery and jsCharts document library in the following section:
<script src="/jquery/jquery.js" type="text/javascript">
   // To load jQuery (redefine the path if necessary)
</script>
<script type="text/javascript" src="/jquery/jscharts.js"></script>
// To load jsCharts (redefine the path if necessary)
Then configure the quantity of columns for the table that will contain the charts, and paste the URLs of the target web pages in the "goPage" array. Remember to strip out the "http://YourSite" initial part, and write them in the order that matches the respective list views on the page.
// DASHBOARD CONFIGURATION
var goPage=new Array('/WebPages/DashboardPage1.aspx','/WebPages/DashboardPage2.aspx','/WebPages/DashboardPage3.aspx','/WebPages/DashboardPage4.aspx');
var cols = 2;   //Number of columns for the charts table
// END OF CONFIGURATION
Finally, paste the script on the Source Editor of the Content Editor Web Part, or upload the file on a document library and use the "Content link" option. Press the "Apply" button and you should get your charts rendered.
Further customizations
Maybe you want to go further and change other features of the solution. For example you can experiment with charts table styling:
<style type="text/css">
       td.tableCell
        {
         background-color:#F5F5F5;
         border-style: ridge;
         text-align: center;
        }
</style>
Or you can customize charts properties, like the ones included in the script:
  myChart.setSize(350, 240);
  myChart.setPieValuesFontSize(9);
  myChart.setPieUnitsFontSize(9);
  myChart.setPieRadius(70);
  myChart.setTitleColor('#000000');
There are several properties you can adjust on jsCharts, review the documentation on their site and have fun!
Follows the complete script. Please let me know if there is any error, as Blogger does not like to show code so a syntax problem could occur on its transcription:
<!-- Script to create a dashboard on a web part page. Pie charts, created using jsChart, -->
<!-- are organized on a table, and are "clickable", pointing to other pages of the site. -->
<!-- The quantity of charts is defined by the list view web parts included on the main  -->
<!-- page and titles of the charts are automatically detected. List views can be hidden.  -->
<!-- Look below the script configuration options  -->

<table id="chartsTable">
     <tbody>
     </tbody>
</table>

<style type="text/css">
      td.tableCell
       {
    background-color:#F5F5F5;
   border-style: ridge;
   text-align: center;
}
</style>

<script src="/jquery/jquery.js" type="text/javascript">
  // To load jQuery (redefine the path if necessary)
</script>
<script type="text/javascript" src="/jquery/jscharts.js"></script>
// To load jsCharts (redefine the path if necessary)

<script type="text/javascript">
/*

* WORKING VERSION 3.0
* Multiple Clickable charts, with jsCharts
* By Claudio Cabaleyro (2009)
*/

$("document").ready(function ($) {

// DASHBOARD CONFIGURATION

var goPage=new Array('/WebPages/DashboardPage1.aspx','/WebPages/DashboardPage2.aspx','/WebPages/DashboardPage3.aspx','/WebPages/DashboardPage4.aspx');
var cols = 2;             //Number of columns for the charts table
// END OF CONFIGURATION

function getTitle(WP)
{
var guid = WP.getAttribute("webpartid").toUpperCase();
var id = WP.id;
var ctx = g_ViewIdToViewCounterMap["{"+guid+"}"];
 ctx = (!ctx)?{}:eval("ctx"+ctx);
var title = id.replace(/WebPartWPQ/,"#WebPartCaptionWPQ");
 title = $(title);
 return (title.length==0)?guid:title.prev().text().replace(/(Hidden)/,"");
};

function buildData(webPart)
 {
 $(webPart).find('td.ms-gb:contains(":")').each(function(i,e)
           {
   var MyIf= $(e).text();
   var unitNumber=parseFloat(MyIf.substring(MyIf.indexOf('(')+1,MyIf.length-1)); // Extract the 'Y' coordinates
   var unit= MyIf.substring(MyIf.indexOf(':')+2,MyIf.indexOf("(")-1); // Extract the labels
   var unitEntry = [unit, unitNumber];
   myData.push(unitEntry);
   });
 return myData;
 };

var ListViewArray = $('div[webpartid]:has(table.ms-listviewtable td.ms-gb)');
rows=1;
while (ListViewArray.length > cols*rows) rows += 1;
var html = '<tbody>';
j=0;
for (var r = 1; r <= rows; r++)
{
html += '<tr>';
for (var c = 1; c <= cols; c++)
 {
 clickableCell=(j<ListViewArray.length)?'<div id="chart'+j+'" style="cursor:pointer;" onclick="window.open('+goPage[j]+','_self')"></div>':'<div id="chart'+j+'"><p>No Chart To Show</p></div>';
 html += '<td class="tableCell" col="' + c +'">' + clickableCell + '</td>';
 j=j+1;
 };
html += '</tr>';
};
html += '</tbody>';
// console.log("html: "+ html);
$('#chartsTable').append(html);

for (j=0; j<ListViewArray.length; j++)
 {
 var myData= new Array();
 var container='chart'+j;
 var myChart = new JSChart(container, 'pie');
 myData=buildData(ListViewArray[j]);
 myChart.setDataArray(myData);
 myChart.setSize(350, 240);
 myChart.setPieValuesFontSize(9);
 myChart.setPieUnitsFontSize(9);
 myChart.setPieRadius(70);
 myChart.setTitle(getTitle(ListViewArray[j]));
 myChart.setTitleColor('#000000');
 myChart.draw();
 };

})(jQuery);
</script>

9 comments:
Hi, thank you for this new post. I followed your direction, and I was able to see the javascript within the html when I used Firebug. But it looks like the script is not being used. I couldn't put a break point to debug it.
What do you recommend?
Thank you
Hi Xixi,
First of all, check the syntax of the code as some times in the copy/paste process, quotes (single and double) can change into your code editor.
Then check that jQuery and JSCharts libraries are correctly loaded in the page.
I recommend you to use Firebug add-in for debugging, if you already do not do so. Using Firebug and inserting in the code lines like this:
console.log(ListViewArray);
you should receive an object representing the list view web parts in your page, for example. I can recommend you to take a look at this great debugging session from Paul Grenier:
http://www.endusersharepoint.com/?p=1417
Hope this helps!
I follwed the steps which directed, but the chart is not appearing and it is not showing anything in CEWP.
Please help.
Thanks
Gee
Hi Geetha,
Be sure to upload both jQuery and JSCharts files on a Document Library of your choice and adjust the path in the <script> tags accordingly in the code. Also review my previous comment on single and double quotes.
Hi, we are using your code fine on several site collection but for some reason it's not working on one of our collections, all we get is an error in 2 columns that says "No Chart To Show" any ideas why it would work on one site collection but not another? We copied the jscharts and jsquery files to the new site collection as well.
Hi,
I have this working. I like it :) It's a cool and very easy way to add charts to a list.
However, I do have two issues:
1) The titles that appear at the top of my chart display correctly only for as long as I'm in edit mode. When I exit edit mode, the chart titles become strings of alpha-numeric text with dashes mixed in.
How can I force my chart titles to display correctly when I am not in edit mode?
2) The colors in my pie chart seem as if they are randomly selected. Every time I open or refresh the page, the pie charts change colors. Sometimes the color combinations are better, sometimes they are worse :)
How can I force my pie charts to use the same 8 colors each time the page is openned or refreshed?
Thanks!
Hi Jeremiah,
The message "No Chart to Show" is presented when for any reason the script does not find as many ListView web parts as cells you set up in the table holding the charts.
Hi VDF,
1)The Chart titles are read from the corresponding ListView Web Part, from its "caption" (title) attribute. Not sure what could cause the effect you describe.
2) The color series on each chart are generated by the jsCharts library and it is ramdom-generated on each call. You need to further customize the code to control the colors. Check the jsCharts API for details.
Regards!
Hello,
I have used this solution and it is wonderful! But I have the same problem as VDF, that the GUID is being displayed instead of the Title once out of edit mode. I tried a million things and even re-created everything with no change.
I am not a programmer however. Would you (or anyone else) have a suggestion on what to look at?
It is great, but for users to not know what there are seeing is not helpful!
Hi DDW,
For some reason, the title in your Listview web part is sensed by the script as having zero length, so the getTitle routine returns the guid.
Could be an odd character in your list name or in the listview web part. Try changing the title property on the ListView web part.
Regards,
Claudio
Post a Comment