Monday, August 17, 2009
Saturday, August 15, 2009
Relayed articles on EUSP
Several of my articles were re-published on End User SharePoint site (Thanks Mark!), so you can go there for additional comments and contributions.
Here the links:
http://www.endusersharepoint.com/?p=1578
http://www.endusersharepoint.com/?p=1714
Friday, May 29, 2009
Pie Charts as a Dashboard
From the feedback I received on my previous posts, I worked to develop a new jQuery script to present charts on SharePoint. It can be considered a major evolution of my first rudimentary pie charts versions because:
- It uses pure JavaScript libraries, no need to send data to the Google Charts API (i.e. internet).
- Charts are nicely arranged within an HTML table, with configurable columns.
- When you click on a chart, you jump to a target page showing the underlying list view.
- Represented data can be taken from different SharePoint lists.
- At least in theory, an unlimited number of charts can be accommodated on a page.
Here is how the result looks like:
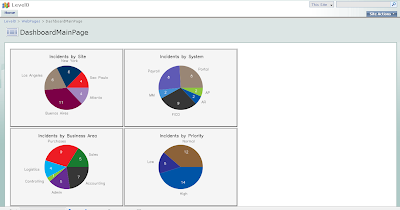
I achieved that with the help of the free jsCharts library, and the invaluable code of Paul Grenier, in particular on this EUSP article.
What's the trick? Let us take a brief look at the actual objects on the page:
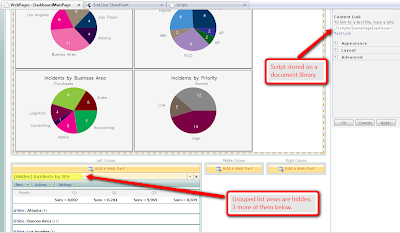
The charts are within a Content Editor Web Part holding the script, in this case stored as a file on a document library (another trick I have learned from Paul Grenier). Below of the CEWP, there are 4 List View web parts showing grouped items. In the example, I made List View web parts hidden and used only one list, but this is not strictly necessary.
So, what do you need to put this at work?
I will assume that you know how to: create grouped views on lists, create web part pages, add list view web parts and configure them to show specific views. I will also assume that you have jQuery available on your site and know how to insert a script on a Content Editor Web Part. Drop me a note if something below is too badly explained.
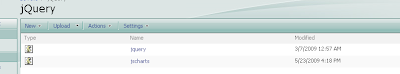
In the first place, you need the jsCharts library available, for example stored on the document library that you use for jQuery:
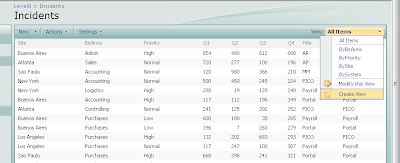
Second step is to create the Grouped Views you plan to use for your charts, using the default SharePoint list view page:
Now you are ready to build your dashboard target pages, using one of the grouped views you just created on each new page. Here is an example:
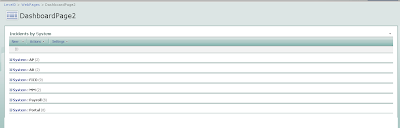
Build as many pages as lists grouped views you plan to show as Pie Charts, but take into account that if you put too many charts, loading the dashboard page can take a while. Keep track of the URL of each new page as you will need it later to configure the script.
NOTE: you will probably ask why instead of creating different pages to show charts underlying data, do not use the already available web parts on the dashboard page... quite frankly, me too!... I did not find yet the way to do that, but it could make the dashboard much more elegant.
The time to create the dashboard page has come!
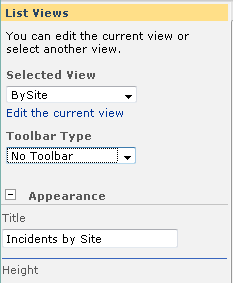
Create a new web part page and insert the Content Editor Web Part to hold the script for the charts. Then add and arrange the list views in the order you want the charts to be displayed. For each list view, configure the following on the tool panel:
- Selected View (choose one of the views you formerly created).
- Title (this will be presented as the chart title)
- On the Layout section select "Hidden" (check box).
Now open your favorite text editor an paste the complete script code by the end of this post. Configure the path for your jQuery and jsCharts document library in the following section:
Then configure the quantity of columns for the table that will contain the charts, and paste the URLs of the target web pages in the "goPage" array. Remember to strip out the "http://YourSite" initial part, and write them in the order that matches the respective list views on the page.
Finally, paste the script on the Source Editor of the Content Editor Web Part, or upload the file on a document library and use the "Content link" option. Press the "Apply" button and you should get your charts rendered.
Further customizations
Maybe you want to go further and change other features of the solution. For example you can experiment with charts table styling:
Or you can customize charts properties, like the ones included in the script:
There are several properties you can adjust on jsCharts, review the documentation on their site and have fun!
Follows the complete script. Please let me know if there is any error, as Blogger does not like to show code so a syntax problem could occur on its transcription:
- It uses pure JavaScript libraries, no need to send data to the Google Charts API (i.e. internet).
- Charts are nicely arranged within an HTML table, with configurable columns.
- When you click on a chart, you jump to a target page showing the underlying list view.
- Represented data can be taken from different SharePoint lists.
- At least in theory, an unlimited number of charts can be accommodated on a page.
Here is how the result looks like:

I achieved that with the help of the free jsCharts library, and the invaluable code of Paul Grenier, in particular on this EUSP article.
What's the trick? Let us take a brief look at the actual objects on the page:

The charts are within a Content Editor Web Part holding the script, in this case stored as a file on a document library (another trick I have learned from Paul Grenier). Below of the CEWP, there are 4 List View web parts showing grouped items. In the example, I made List View web parts hidden and used only one list, but this is not strictly necessary.
So, what do you need to put this at work?
I will assume that you know how to: create grouped views on lists, create web part pages, add list view web parts and configure them to show specific views. I will also assume that you have jQuery available on your site and know how to insert a script on a Content Editor Web Part. Drop me a note if something below is too badly explained.
In the first place, you need the jsCharts library available, for example stored on the document library that you use for jQuery:

Second step is to create the Grouped Views you plan to use for your charts, using the default SharePoint list view page:

Now you are ready to build your dashboard target pages, using one of the grouped views you just created on each new page. Here is an example:

Build as many pages as lists grouped views you plan to show as Pie Charts, but take into account that if you put too many charts, loading the dashboard page can take a while. Keep track of the URL of each new page as you will need it later to configure the script.
NOTE: you will probably ask why instead of creating different pages to show charts underlying data, do not use the already available web parts on the dashboard page... quite frankly, me too!... I did not find yet the way to do that, but it could make the dashboard much more elegant.
The time to create the dashboard page has come!
Create a new web part page and insert the Content Editor Web Part to hold the script for the charts. Then add and arrange the list views in the order you want the charts to be displayed. For each list view, configure the following on the tool panel:
- Selected View (choose one of the views you formerly created).
- Title (this will be presented as the chart title)
- On the Layout section select "Hidden" (check box).

Now open your favorite text editor an paste the complete script code by the end of this post. Configure the path for your jQuery and jsCharts document library in the following section:
<script src="/jquery/jquery.js" type="text/javascript">
   // To load jQuery (redefine the path if necessary)
</script>
<script type="text/javascript" src="/jquery/jscharts.js"></script>
// To load jsCharts (redefine the path if necessary)
Then configure the quantity of columns for the table that will contain the charts, and paste the URLs of the target web pages in the "goPage" array. Remember to strip out the "http://YourSite" initial part, and write them in the order that matches the respective list views on the page.
// DASHBOARD CONFIGURATION
var goPage=new Array('/WebPages/DashboardPage1.aspx','/WebPages/DashboardPage2.aspx','/WebPages/DashboardPage3.aspx','/WebPages/DashboardPage4.aspx');
var cols = 2;   //Number of columns for the charts table
// END OF CONFIGURATION
Finally, paste the script on the Source Editor of the Content Editor Web Part, or upload the file on a document library and use the "Content link" option. Press the "Apply" button and you should get your charts rendered.
Further customizations
Maybe you want to go further and change other features of the solution. For example you can experiment with charts table styling:
<style type="text/css">
       td.tableCell
        {
         background-color:#F5F5F5;
         border-style: ridge;
         text-align: center;
        }
</style>
Or you can customize charts properties, like the ones included in the script:
  myChart.setSize(350, 240);
  myChart.setPieValuesFontSize(9);
  myChart.setPieUnitsFontSize(9);
  myChart.setPieRadius(70);
  myChart.setTitleColor('#000000');
There are several properties you can adjust on jsCharts, review the documentation on their site and have fun!
Follows the complete script. Please let me know if there is any error, as Blogger does not like to show code so a syntax problem could occur on its transcription:
<!-- Script to create a dashboard on a web part page. Pie charts, created using jsChart, -->
<!-- are organized on a table, and are "clickable", pointing to other pages of the site. -->
<!-- The quantity of charts is defined by the list view web parts included on the main  -->
<!-- page and titles of the charts are automatically detected. List views can be hidden.  -->
<!-- Look below the script configuration options  -->

<table id="chartsTable">
     <tbody>
     </tbody>
</table>

<style type="text/css">
      td.tableCell
       {
    background-color:#F5F5F5;
   border-style: ridge;
   text-align: center;
}
</style>

<script src="/jquery/jquery.js" type="text/javascript">
  // To load jQuery (redefine the path if necessary)
</script>
<script type="text/javascript" src="/jquery/jscharts.js"></script>
// To load jsCharts (redefine the path if necessary)

<script type="text/javascript">
/*

* WORKING VERSION 3.0
* Multiple Clickable charts, with jsCharts
* By Claudio Cabaleyro (2009)
*/

$("document").ready(function ($) {

// DASHBOARD CONFIGURATION

var goPage=new Array('/WebPages/DashboardPage1.aspx','/WebPages/DashboardPage2.aspx','/WebPages/DashboardPage3.aspx','/WebPages/DashboardPage4.aspx');
var cols = 2;             //Number of columns for the charts table
// END OF CONFIGURATION

function getTitle(WP)
{
var guid = WP.getAttribute("webpartid").toUpperCase();
var id = WP.id;
var ctx = g_ViewIdToViewCounterMap["{"+guid+"}"];
 ctx = (!ctx)?{}:eval("ctx"+ctx);
var title = id.replace(/WebPartWPQ/,"#WebPartCaptionWPQ");
 title = $(title);
 return (title.length==0)?guid:title.prev().text().replace(/(Hidden)/,"");
};

function buildData(webPart)
 {
 $(webPart).find('td.ms-gb:contains(":")').each(function(i,e)
           {
   var MyIf= $(e).text();
   var unitNumber=parseFloat(MyIf.substring(MyIf.indexOf('(')+1,MyIf.length-1)); // Extract the 'Y' coordinates
   var unit= MyIf.substring(MyIf.indexOf(':')+2,MyIf.indexOf("(")-1); // Extract the labels
   var unitEntry = [unit, unitNumber];
   myData.push(unitEntry);
   });
 return myData;
 };

var ListViewArray = $('div[webpartid]:has(table.ms-listviewtable td.ms-gb)');
rows=1;
while (ListViewArray.length > cols*rows) rows += 1;
var html = '<tbody>';
j=0;
for (var r = 1; r <= rows; r++)
{
html += '<tr>';
for (var c = 1; c <= cols; c++)
 {
 clickableCell=(j<ListViewArray.length)?'<div id="chart'+j+'" style="cursor:pointer;" onclick="window.open('+goPage[j]+','_self')"></div>':'<div id="chart'+j+'"><p>No Chart To Show</p></div>';
 html += '<td class="tableCell" col="' + c +'">' + clickableCell + '</td>';
 j=j+1;
 };
html += '</tr>';
};
html += '</tbody>';
// console.log("html: "+ html);
$('#chartsTable').append(html);

for (j=0; j<ListViewArray.length; j++)
 {
 var myData= new Array();
 var container='chart'+j;
 var myChart = new JSChart(container, 'pie');
 myData=buildData(ListViewArray[j]);
 myChart.setDataArray(myData);
 myChart.setSize(350, 240);
 myChart.setPieValuesFontSize(9);
 myChart.setPieUnitsFontSize(9);
 myChart.setPieRadius(70);
 myChart.setTitle(getTitle(ListViewArray[j]));
 myChart.setTitleColor('#000000');
 myChart.draw();
 };

})(jQuery);
</script>
Wednesday, April 29, 2009
Dynamic Charts & Graphs in SharePoint (Part III) - Multiple Pie Charts

I finally got a script to get multiple Pie Charts on the same page!!!
In the screenshot, I show an hypothetical systems issues list, grouped by priority, status, system and site. You can represent different views of the same list or you can include multiple lists!!!
NOTE 1: avoid group by columns with "(" and ")" symbols as part of its name. Otherwise you should modify the code accordingly, because those are used to isolate the number of items within each group.
NOTE2: do not use this technique to represent sensitive data, as it travels through the Internet to the Google Charts service.
Here the process to implement:
1) Plan your page, that is, pre-define how many charts you will need (for some reason, if you add List View web parts AFTER you have inserted the script, new charts might not be rendered).
2) Create the Grouped views that you will need through the default List View, so you when you add the list views to the page, you can simply select the desired view from the drop down list.
3) Create a new web part page, add the List View web parts you previously defined, and arrange them (up to down, left to right) in the order you want the charts to appear.
4) Copy the script to your preferred editor and:
a) Configure the colors for your charts in the following code line:
chColor=new Array("FF6600","006600","000066","C0C0C0");
If you plan to use more than 4 charts, add more color codes with the same pattern.
b) If you want, change the size (in pixels) and type of chart ("p" or "p3") in the following portion of the URL for the charts:
...chart.apis.google.com/chart?cht=p&chco="+col+"&chs=500x150&chd=t:"+txt+"&chl="+txt1
For more information on how to customize the chart, see http://code.google.com/apis/chart/
c) Edit the path at the beginning of the script so it points to your jQuery library store.
5) Insert a CEWP (Content Editor Web Part) on the page, open the toolpane, then Source Editor and paste the script you have just configured. Thats it!
6) You can hide part or all the List Views so the page does not look "congested". To do so, open the tool pane of the List View web parts, go to "Layout" section and check "Hidden".
I hope you enjoy this!
<div id="jLoadMe" class="content"><strong></strong></div>


<script src="/jquery/jquery.js" type="text/javascript">

   // To load jQuery (redefine the path if necessary)

</script>


<script type="text/javascript">

/*

* WORKING VERSION 1.0

* Multiple Pie Charts in SharePoint

* By Claudio Cabaleyro (2009)

*/


$("document").ready(function () {

  chColor=new Array("FF6600","006600","000066","C0C0C0");  // add more colors if you include more than 4 ListView web parts

  var ListViewArray = $('table.ms-listviewtable');

  $(ListViewArray).each (function(j) {

   var Grp = $(this).find ('td.ms-gb:contains(":")');


     var coord= new Array();

     var labels= new Array();

     $.each(Grp, function(i,e) {

      var MyIf= $(e).text();

      var txt= MyIf.substring(MyIf.indexOf('(')+1,MyIf.length-1); // Extract the 'Y' coordinates

      coord[i]=txt;

      var txt1= MyIf.substring(MyIf.indexOf(':')+2,MyIf.indexOf("(")-1); // Extract the labels

      labels[i]=txt1+"("+txt+")";   //add also coordinates for better read

     });

   var txt= coord.join(",");

   var txt1= labels.join("|");

   col= chColor[j];


   // Adjust Chart Properties below - See Google Charts API for reference

   var vinc= "<IMG src='http://chart.apis.google.com/chart?cht=p&chco="+col+"&chs=500x150&chd=t:"+txt+"&chl="+txt1+"'/>";

   if (j%2 == 0)

    ;

    else

    vinc=vinc +"<br>";


   $("#jLoadMe").append(vinc)

  });

})();

</script>
Saturday, April 11, 2009
Dynamic Charts & Graphs in SharePoint (Part II)

SharePoint allows you to define list views that calculate Sum, Average, Min, Max, Standard Dev, etc. on the items, whenever your list has at least one numeric field or column.
The script below, combined with such a list view, will plot a Google Chart showing those totals dynamically. The chart scale is automatically adjusted with the maximum value to be charted so it fits the designated size in the script.
Once implemented, you can hide the list view web part so only the chart will render on the page. You can also play around with chart parameters within the script, to change chart type, style, size, colors or even build more complex charts. Take a look at the Google Chart API page for reference.
Hope this could be useful.
Here a step-by-step screen capture series:


<div id="jLoadMe" class="content"></div>
<script src="/jquery/jquery.js" type="text/javascript">
// To load jQuery (redefine the path if necessary)
</script>
<script type="text/javascript">
/*
* Google Chart for list column totals
* By Claudio Cabaleyro (2009)
*/
Array.prototype.max = function() { // function to get the maximum value of Y axis
var max = this[0];
var len = this.length;
for (var i = 1; i < len; i++) if (this[i] > max) max = this[i];
return max;
}
function BuildChartURL(Data, Names) // Adjust Chart Properties below - See Google Charts API for reference
{
MaxData= Math.round(1.1*Data.max()).toString();
var DataPoints= "&chd=t:"+Data.join(",");
var DataTitles= "&chl="+Names.join("|");
var ChType= "cht=bvs"; // Vertical bars type
var ChSize = "&chs=300x200"; //HeighxWidth in px
var ChScale = "&chds=0,"+MaxData; //Vertical scale: 0 through 10% over max series value
var ChLabels ="&chm=N,000000,0,-1,11,-1";
return ("<p><IMG src='http://chart.apis.google.com/chart?"+ChType+ChSize+DataPoints+DataTitles+ChScale+ChLabels+"'/></p>");
}
var ArrayTitle= $('.ms-unselectedtitle:html'); //find all columns in titles row
var TitleTxt = new (Array);
$.each(ArrayTitle, function(i,e)
{
TitleTxt[i] = $(e).text(); // Store ALL column titles in TitleTxt
});
var ArrayTotal= $('.ms-vb2', $('#aggr')); //find all columns in totals row
var TotalTxt = new (Array);
$.each(ArrayTotal, function(i,e)
{
TotalTxt[i] = $(e).text().substr($(e).text().indexOf("= ")+2); // Store ALL column totals in TotalTxt
});
var Titles = new (Array);
var Totals = new (Array);
$.each(TitleTxt, function(i,e) // clear empty elements in totals row
{
if (TotalTxt[i] != "" && TotalTxt[i] != null)
{
Titles.push(TitleTxt[i]);
Totals.push(parseFloat(TotalTxt[i].replace(',','')));
}
});
$("#jLoadMe").append(BuildChartURL(Totals, Titles))
</script>
Friday, April 3, 2009
Dynamic Charts & Graphs in SharePoint
Inspired by the GREAT jQuery series by Paul Grenier at EndUserSharePoint and the TERRIFIC ideas of Christophe at Sparklines and other charts in SharePoint lists, I have built a small jQuery script and used Google Charts service to get the following (click to enlarge):

I based the example in a FAQ list, so the chart shows the distribution of questions among the different "Topics".
Being a little more general, the chart shows the statistical distribution of items from an underlying SharePoint list, being the groups defined by the meaning of the column chosen to "Group by" in the list view.
You can think of representing statuses of an issues list, completion percentages on a task list, and so on. You can even explore the use of calculated columns in innovative ways to define your groups... (I just thought about that!)
Solution
I will not present a detailed step-by-step approach here, you can drop me a note if you have doubts.
Recipe:
1) On the list you want to base your chart, create a "Group By" view.
2) Create a new web part page and insert the just created list view.
3) Insert a Content Editor Web Part and paste the code below (remember to use the Source Editor).
That's it!
NOTICE: if you are new to jQuery, you need to install it prior to use the code. You just need to upload it on a Document Library as explained here, Do not forget to adjust the path at the beginning of the code, to point to your library.
*** UPDATE: when you copy the code to your script editor, take a look at quotes (single and double) as they can cause a wrong script.
<div id="jLoadMe" class="content">PieChart</div>

<script src="/jquery/jquery.js" type="text/javascript">
   // To load jQuery (redefine the path if necessary)
</script>

<script type="text/javascript">

 var arrayList=$("td.ms-gb:contains(':')");
 var coord= new Array();
 var labels= new Array();
 $.each(arrayList, function(i,e)
 {
  var MyIf= $(e).text();
  var txt= MyIf.substring(MyIf.indexOf('(')+1,MyIf.length-1); // Extract the 'Y' coordinates
  coord[i]=txt;
  var txt1= MyIf.substring(MyIf.indexOf(':')+2,MyIf.indexOf("(")-1); // Extract the labels
  labels[i]=txt1+"("+txt+")";   //add also coordinates for better read
 });
var txt= coord.join(",");
var txt1= labels.join("|");

// Adjust Chart Properties below - See Google Charts API for reference
var vinc= "<IMG src='http://chart.apis.google.com/chart?cht=p3&chs=500x200&chd=t:"+txt+"&chl="+txt1+"'/>";
$("#jLoadMe").append("<p>"+vinc+"</p>")
 </script>
TIP I: you can hide the list view in your page so only the chart is rendered (click to enlarge):

To do that, edit the page and look for the "Hidden" check box in the web part panel(click to enlarge):

TIP II: you can experiment changing the chart type, colors and size through the parameters in the URL by the end of the code. Check the Google Charts API documentation and have fun!!!
Saturday, March 21, 2009
Experimentando con jQuery
Situación
Còmo encarar el proceso para crear y debuggear un script jQuery. Mediante un ejemplo, trabajaremos sobre una pàgina que contenga una lista con al menos una columna de tipo calcHTML. Este post se basa en el video de Paul Grenier en EndUserSharePoint
Solución
OBJETIVO DEL SCRIPT:
Si en una columna de una lista SharePoint tenemos còdigo HTML, el browser lo despliega literalmente, es decir con los tags visibles. Para que se despliegue en forma correcta tenemos que: localizar los objetos en la definiciòn del HTML de la pàgina y transformarlos mediante jQuery.
La pàgina para debug contiene inicialmente una list web part, donde al menos una columna es de tipo calcHTML, por ejemplo para mostrar letras grandes y en rojo queda definida como:
"<DIV style='font-weight:bold; font-size:12px; color:red; display: inline;'>ALGUN TEXTO</DIV>").
1) El primer paso es agregar una CEWP y el siguiente còdigo inicial, que cargarà el jQuery para poder invocarlo:
<script src="/jquery/jquery.js" type="text/javascript"></script>
<script type="text/javascript">
2) Usando Firebug, inspeccionamos los elementos de la columna tipo calcHTML, para detectar dentro de què objetos se encuentra. Es conveniente buscar en el DOM los "child nodes" del objeto y dentro de estos si el nodename tiene el atributo "text". Tambien se puede observar el innerHTML en busca de una referencia codificada.
3) Copiando el innerHTML que se encuentre (por ejemplo: ""& l t;p style='font-weight:bold;..."") lo pegamos en Notepad++ para posterior uso.
4) Para empezar a "jugar" con Firebug, conviene buscar los objetos que contienen el nodo identificado antes y podemos empezar a probar la funciòn jQuery que los encuentre. Por ejemplo:
$("td.ms-vb2")
devuelve varios objetos, incluyendo a los que estàn en la columna calcHTML.
5) Luego decidimos chequear el atributo "text" entonces ingresamos en Firebug Console lo siguiente:
$("td.ms-vb2").text()
Veremos todos los textos, en el ejemplo que estamos viendo, darà los contenidos de la columna calcHTML.
6) Ahora hay que construir una "Regular Expression" (ver Tutorial) que encuentre los tags definidos en la columna calcHTML. La funciòn jQuery:
$("td.ms-vb2").text().match(/<[^<]+?>/)
encuentra el primer tag HTML (cualquiera que sea), incluyendo los atributos de estilo si es que los tuviera. El mismo resultado, con una regular expression màs completa:
$("td.ms-vb2").text().match(/<[^<]+?>|<.+?>/)
7) Ahora podemos empezar a escribir algo de còdigo. Para obtener todos los elementos los guardamos en un array y para cada elemento verificamos contra la regular expression, probando en la consola de FireBug:
var arrayList=$("td.ms-vb2");
$.each(arrayList, function(i,e)
{
var MyIf= $(e).text().match(/<[^<]+?>|<.+?>/);
console.log(MyIf);
});
8)Luego aplicamos la funciòn jQuery para convertir en html el resultado:
var arrayList=$("td.ms-vb2");
$.each(arrayList, function(i,e)
{
var txt= $(e).text().match(/<[^<]+?>|<.+?>/);
$(e).html($(e).text());
});
FUNCIONA EN LA CONSOLA!
9) Esta porciòn de còdigo se introduce en la Content Editor Web Part que contiene la invocaciòn a jQuery y listo. Paul provee el còdigo completo en el siguiente blog post.
Subscribe to:
Posts (Atom)