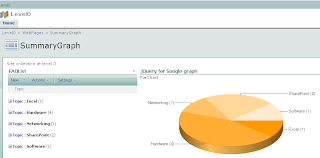
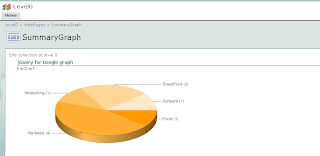
Inspired by the GREAT jQuery series by Paul Grenier at EndUserSharePoint and the TERRIFIC ideas of Christophe at Sparklines and other charts in SharePoint lists, I have built a small jQuery script and used Google Charts service to get the following (click to enlarge):

I based the example in a FAQ list, so the chart shows the distribution of questions among the different "Topics".
Being a little more general, the chart shows the statistical distribution of items from an underlying SharePoint list, being the groups defined by the meaning of the column chosen to "Group by" in the list view.
You can think of representing statuses of an issues list, completion percentages on a task list, and so on. You can even explore the use of calculated columns in innovative ways to define your groups... (I just thought about that!)
Solution
I will not present a detailed step-by-step approach here, you can drop me a note if you have doubts.
Recipe:
1) On the list you want to base your chart, create a "Group By" view.
2) Create a new web part page and insert the just created list view.
3) Insert a Content Editor Web Part and paste the code below (remember to use the Source Editor).
That's it!
NOTICE: if you are new to jQuery, you need to install it prior to use the code. You just need to upload it on a Document Library as explained here, Do not forget to adjust the path at the beginning of the code, to point to your library.
*** UPDATE: when you copy the code to your script editor, take a look at quotes (single and double) as they can cause a wrong script.
<div id="jLoadMe" class="content">PieChart</div>

<script src="/jquery/jquery.js" type="text/javascript">
   // To load jQuery (redefine the path if necessary)
</script>

<script type="text/javascript">

 var arrayList=$("td.ms-gb:contains(':')");
 var coord= new Array();
 var labels= new Array();
 $.each(arrayList, function(i,e)
 {
  var MyIf= $(e).text();
  var txt= MyIf.substring(MyIf.indexOf('(')+1,MyIf.length-1); // Extract the 'Y' coordinates
  coord[i]=txt;
  var txt1= MyIf.substring(MyIf.indexOf(':')+2,MyIf.indexOf("(")-1); // Extract the labels
  labels[i]=txt1+"("+txt+")";   //add also coordinates for better read
 });
var txt= coord.join(",");
var txt1= labels.join("|");

// Adjust Chart Properties below - See Google Charts API for reference
var vinc= "<IMG src='http://chart.apis.google.com/chart?cht=p3&chs=500x200&chd=t:"+txt+"&chl="+txt1+"'/>";
$("#jLoadMe").append("<p>"+vinc+"</p>")
 </script>
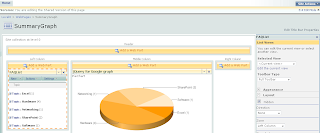
TIP I: you can hide the list view in your page so only the chart is rendered (click to enlarge):

To do that, edit the page and look for the "Hidden" check box in the web part panel(click to enlarge):

TIP II: you can experiment changing the chart type, colors and size through the parameters in the URL by the end of the code. Check the Google Charts API documentation and have fun!!!

4 comments:
Very nice article.
Thanks
Adnan Ahmed
http://www.mossgurus.com/adnan
Genial Solucion Claudio! Gran Aporte a SharePoint, acabo de poner un link a tus articulos en mi blog http://hinsua.blogspot.com
Hi, Thank you for the solution. I tried to do what you suggested. Created a view for my list, group it by "status." Then, I created the content editor, pasted your code into Source Editor, checked the quotes, and adjusted the URL path.
All I see right now is the word "Pie Chart" and a blank space at the bottom of the web part...
I am new to this jQuery. Please let me know if I am missing something.
Thank you so much!
Xixi
Hi Xixi,
In the first place check that the values of the choice column that you use for grouping does not contain parentheses.
Also check if your call to google charts is being correctly formatted. Insert a couple of lines for debugging, like this:
...
var txt= coord.join(",");
var txt1= labels.join("|");
alert("txt :"+txt);
alert("txt1 :"+txt1);
In normal conditions you should receive alerts with your grouped item numbers separated by commas and your group names separated by the pipe (|) character.
You can also check for more comments on the relayed version of this post at:
http://www.endusersharepoint.com/?p=1537
Post a Comment